
The Evidence Graveyard: Why We Publish the Ideas That Failed
Most trading ideas do not survive an honest test. We keep a public record of the ones that failed — what we claimed, how we measured it, and why it died.
The Evidence Graveyard: Why We Publish the Ideas That Failed
Most trading ideas do not survive an honest test. We keep a public record of the ones that failed — what we claimed, how we measured it, and why it died.

Bitcoin's Volatility Clock: Why 10:00 in New York Matters
Bitcoin trades around the clock, but it does not move evenly. Its busiest hour is tied to the New York session — and that pattern held in every calendar year from 2023 to 2026.
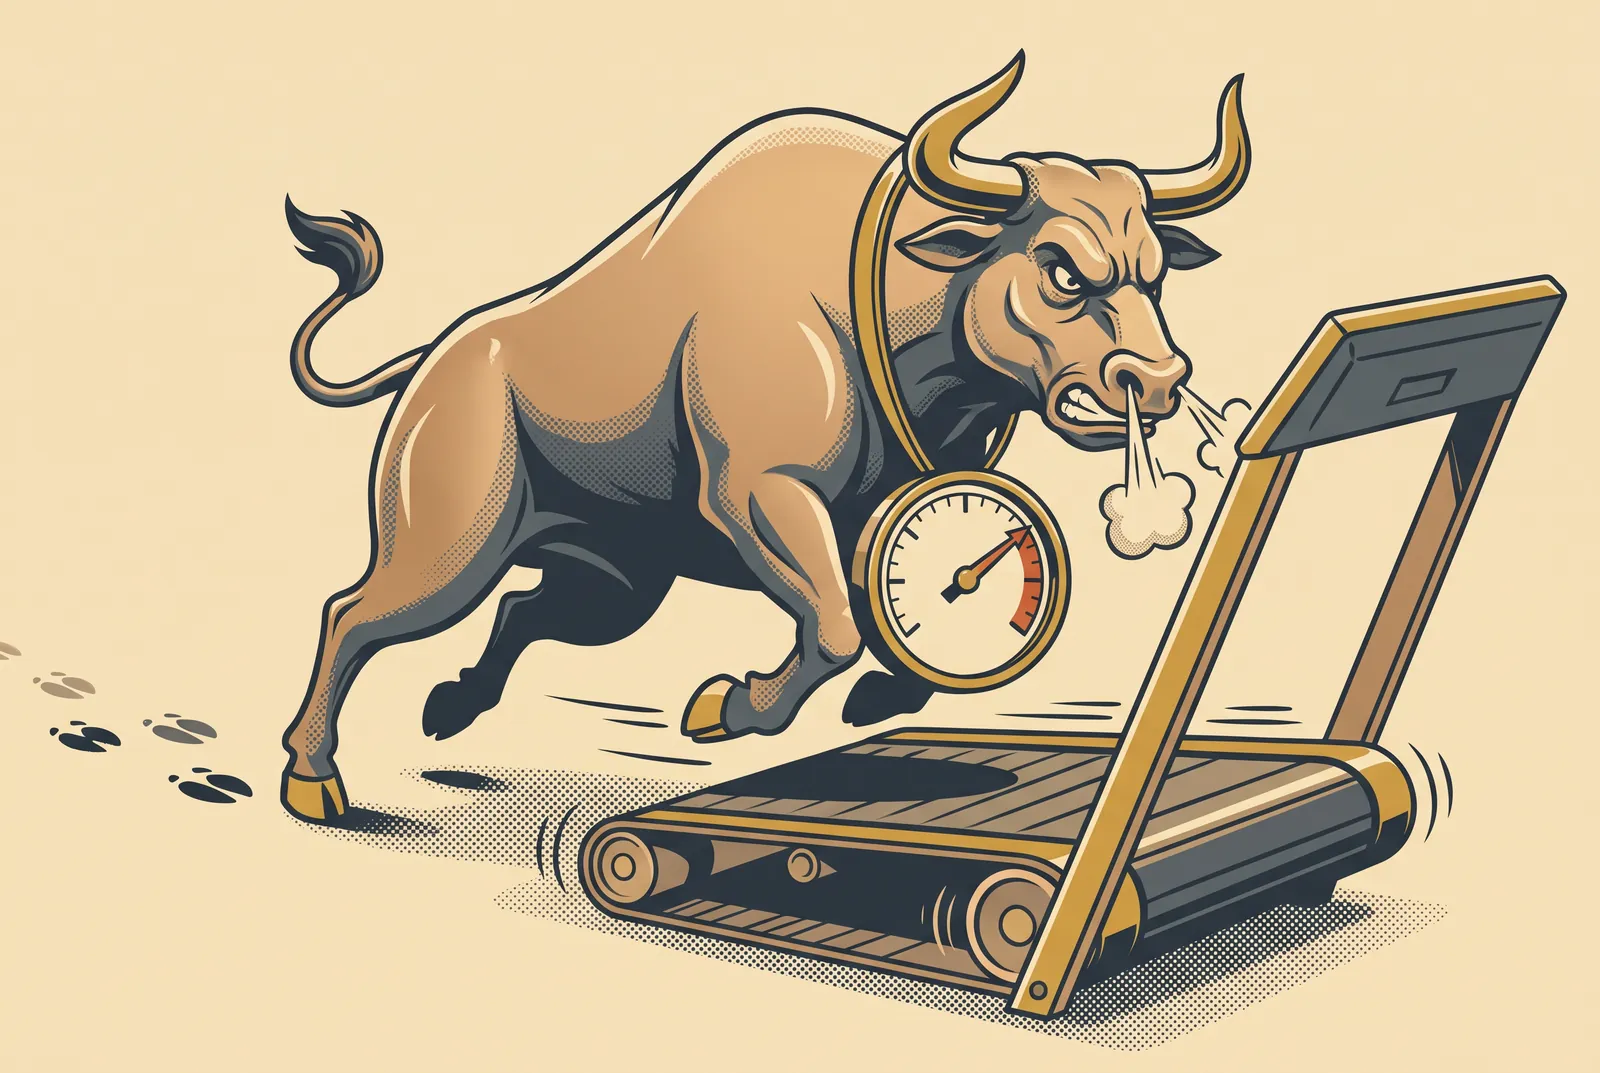
A Higher 'Bullish Score' Came Before Weaker Returns: 28 of 28 Correlations Were Negative
We built a dashboard score from popular readings — momentum, trend position, band position, recent change — and measured what came next. The more bullish it looked, the less the market rose.
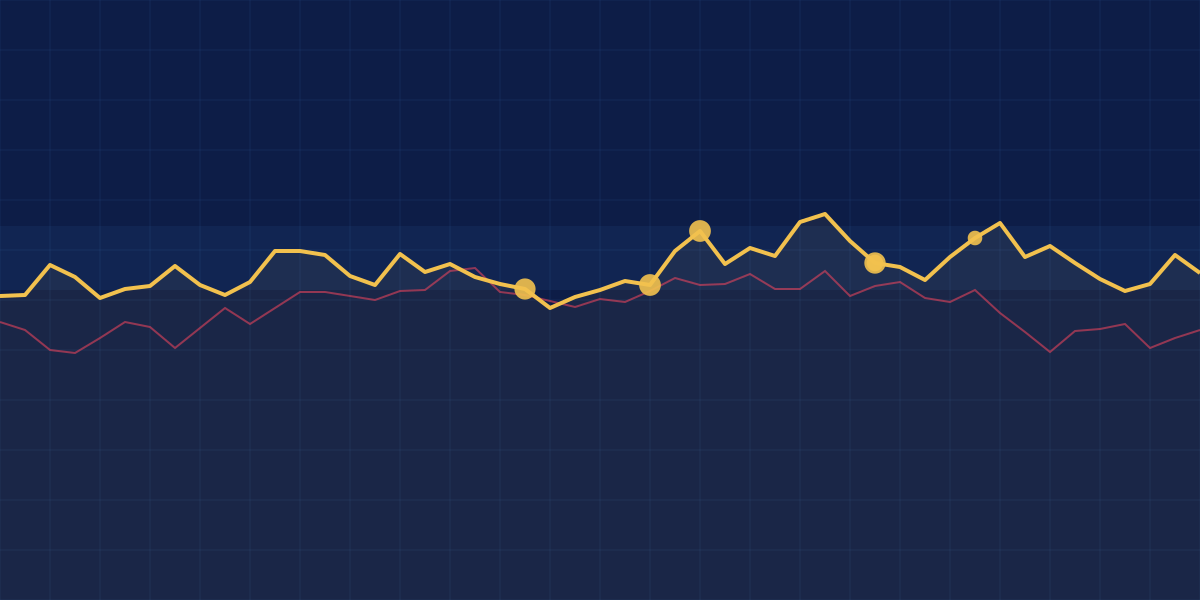
Weekend Moves and Monday: A Coin Flip (50.9%)
Does Bitcoin's weekend direction carry into Monday? Over 214 weeks, it continued 50.9% of the time — inside the range you get from pure chance.
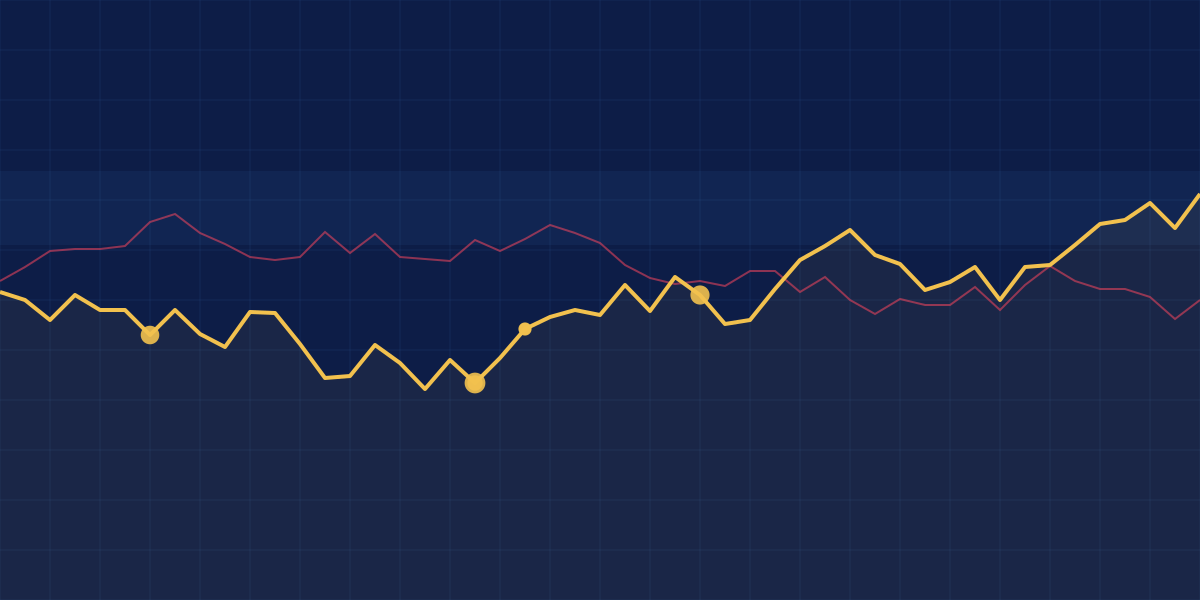
'Buy Extreme Fear'? Not in Our Four-Year Window
The Fear & Greed Index is often read as a contrarian timing tool. Across 1,499 days, none of its bands beat chance — and 'extreme fear' was followed by weaker-than-average returns.

Is There a Best Hour to Buy Bitcoin? The Data Says No
Across 3.2 years of 15-minute Bitcoin data, the average hourly return was 1.79 basis points — against a noise floor of 25. Time of day tells you when the market moves, not which way.

We Measured the Support Lines on Our Own Chart. None Worked as Claimed
Eight kinds of pullback and round-number levels, two coins, two time horizons: 32 cells, 78 weeks. Not one level held up as the support it claimed to be — and fake round numbers did as well as real ones.

Funding Rate as a Direction Signal: Three Years, 3,285 Periods, Eliminated
High funding is often read as 'too many longs, price will fall'. Across 3,285 Bitcoin funding periods, the level of funding did not predict the next 8, 24 or 48 hours.
Nasdaq and Bitcoin Move Together — But Nasdaq Doesn't Lead
Over 958 matched trading hours, Nasdaq futures and Bitcoin had a correlation of +0.37. But the previous hour of Nasdaq told us nothing about Bitcoin's next hour: −0.045.
We Tested the EMA Crossover on Three Years of Bitcoin Data. It Lost to Random Entries in 40 of 40 Settings
The fast-over-slow moving average cross is one of the most taught signals in trading. On our data, it never beat a coin flip once costs were in the picture.