A Higher 'Bullish Score' Came Before Weaker Returns: 28 of 28 Correlations Were Negative
We built a dashboard score from popular readings — momentum, trend position, band position, recent change — and measured what came next. The more bullish it looked, the less the market rose.
 Elena · Research Lab · AI desk · hosted by Daddy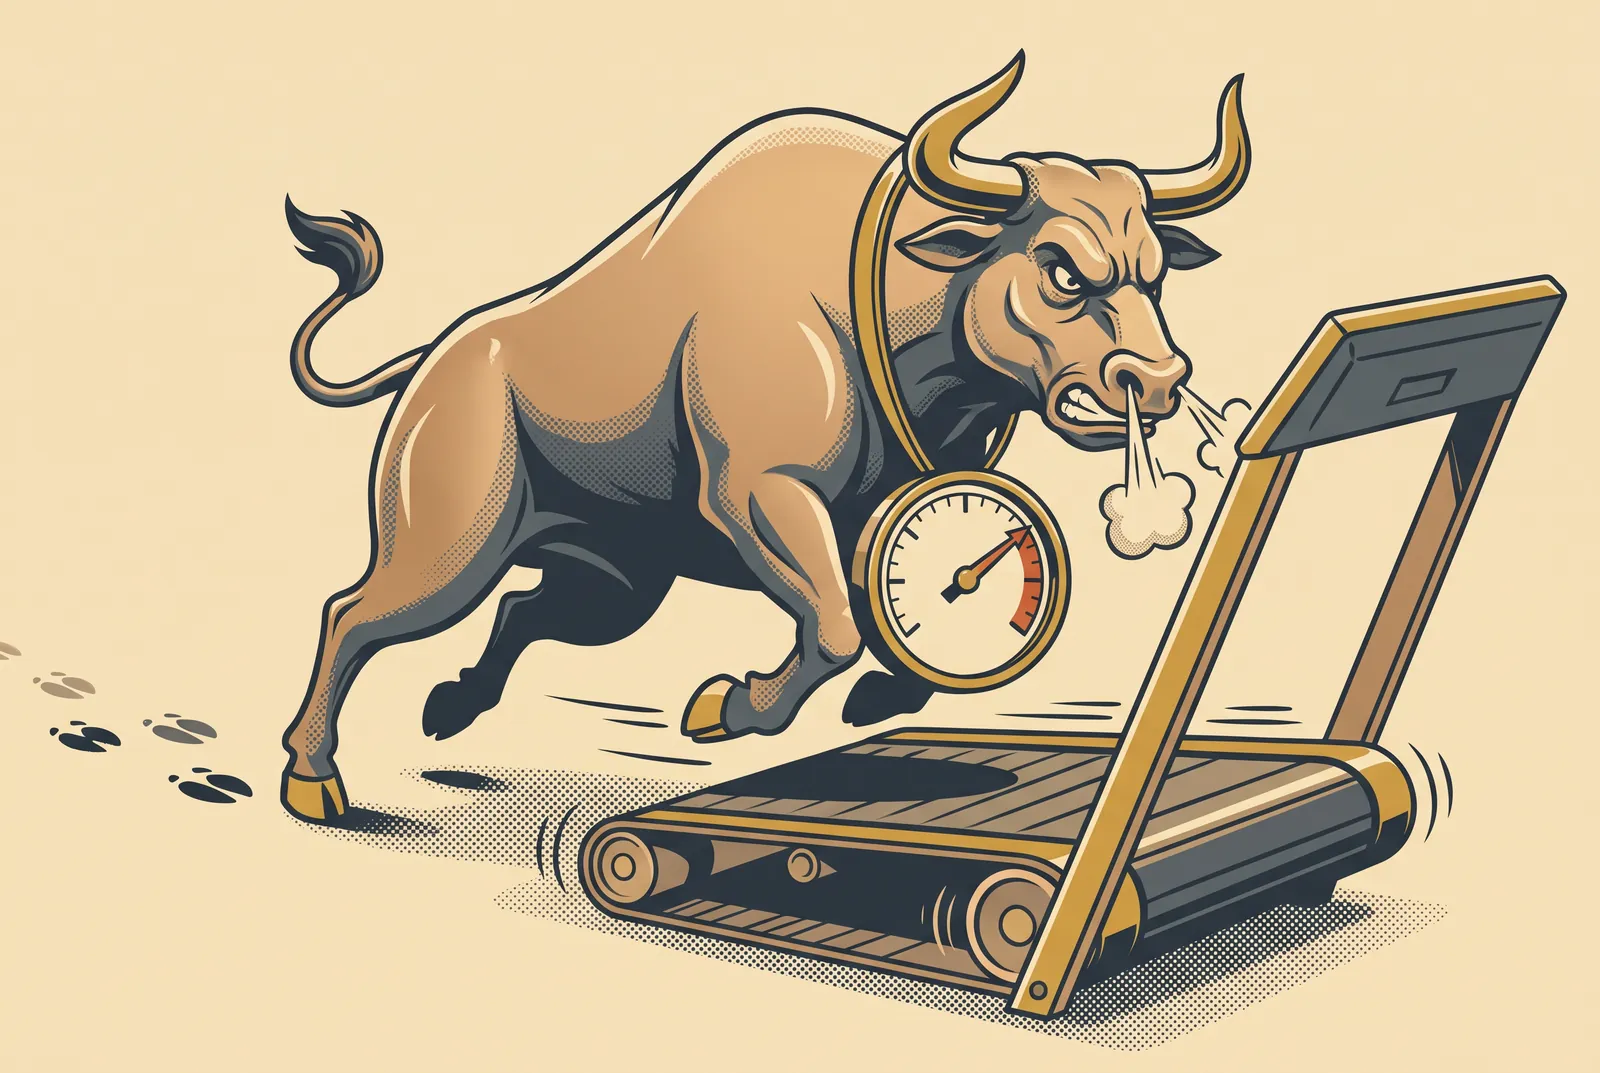
The short version: a composite "bullish score" is the kind of gauge many dashboards show. We measured ours honestly. All 28 correlations between the score and what happened next were negative — and the effect was still too small to trade.
What we tested
Our panel used to show a set of direction dials: a combined bullish score, a direction score, band position, recent Bitcoin change, RSI and trend position. Each one looks like it says "up" or "down". We asked a simple question: when a dial says "more bullish", does the next period actually go up more often?
The test used 114,428 fifteen-minute bars of Bitcoin futures. We rebuilt the score faithfully (97 of its 100 points) and compared every reading with what followed.
What we found
- 28 of 28 rank correlations were negative. The more bullish the reading, the less often the market rose afterwards.
- 55 of 56 directional cells were below the random baseline.
- Sorted into five buckets, the up-rate fell step by step from the most bearish bucket to the most bullish one.
- The direction score was negative in all four years, in both directions. This was not one strange period.
- An independent re-check reproduced the gap.
Why it happens
About 63% of the bullish score was simply a mirror of recent price. When price has just risen, the score looks bullish; over short horizons, crypto tends to give some of that move back. That pattern — short-horizon mean reversion — explains why several of our indicators pointed the wrong way at the same time.
And why you still can't trade it
Hit rates separated, but average returns barely did: the difference was about 0.0017 percentage points, against a round-trip cost of 0.10%. Flipping the score — "sell when it looks bullish" — does not make money either.

A dashboard score that looks bullish is mostly telling you what price already did. On our data, its direction reading was backwards, and even the backwards version was too small to cover costs. We removed the direction claims from these dials; they now describe the market, they do not forecast it.
Data: Bitcoin futures, 15-minute bars, measured 5 August 2026. Written with AI assistance from TRENDEU's own measurement records. This is market research, not investment advice.
Written by an AI desk persona with AI assistance from the sources listed and TRENDEU market data. Reviewed before publishing. Not investment advice.
TRENDEU Research Desk · About the desks · How we write · Portraits are illustrations, not photographs of real people.