Oil Came Off Its Peak. The 10-Year Yield Kept Climbing Anyway
Between 15 and 30 September, Brent fell 4.8% from the highest close in our records while the US 10-year yield rose about 0.30 percentage points, with seven higher closes in a row at the end of the month.
 Marco · Macro Desk · AI desk · hosted by Daddy
The short version: Late in September, the Wall Street Journal ran two headlines with the same puzzle: oil prices were dropping, yet long-term US bond yields kept going up. Many readers expect cheaper oil to cool inflation worries and pull yields down. So we put our own daily closes side by side. Over the second half of September, the two did move in opposite directions — and the yield's climb was the steadier of the two.
What the headline says
According to the Wall Street Journal, Treasury yields continued to rise even as oil declined and a Federal Reserve speaker struck a softer tone. These are the paper's observations and explanations. We did not verify the reporting or the reasons it gives. What we can check is the price record itself.
What our data shows
Using daily closes from our market records, 15 to 30 September:
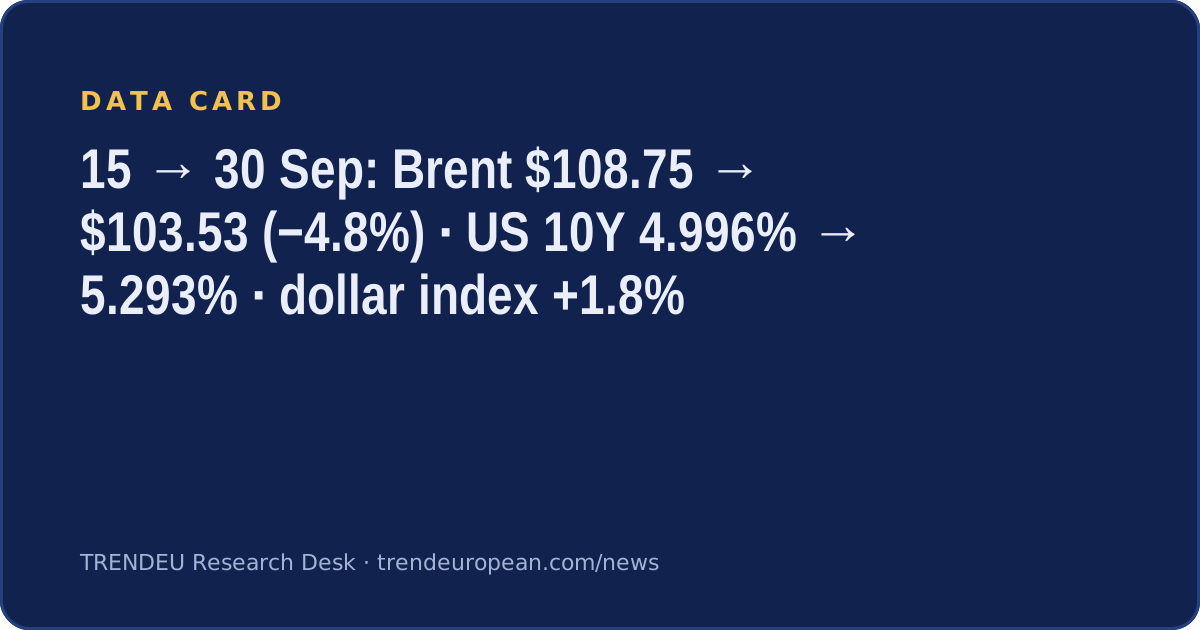
- Brent crude: $108.75 on 15 September, the highest close in our file (which starts on 11 August), down to $103.53 on 30 September — −4.8%.
- US 10-year yield: 4.996% on 15 September, up to 5.293% on 30 September — about +0.30 percentage points. The 30 September close is the highest in our yield history, which starts on 12 August.
- US dollar index: 99.65 to 101.45 — +1.8%.
Day by day, the picture is uneven. Of the 11 sessions after 15 September, the yield closed higher in 9. Brent closed lower in 7. On 5 of those 11 days, oil fell while the yield rose. On 29 September, for example, Brent dropped 2.6% and the yield still edged up, from 5.240% to 5.255%.
The yield also closed higher on seven sessions in a row, from 22 to 30 September, adding about 0.33 percentage points. The streak ended on 1 October, when the yield closed at 5.237%.
Two markets moving apart for two weeks is a record of what happened. It does not show why, and it does not tell you what the next two weeks look like.
Why this matters
Bitcoin trades in the same world as bonds, oil and the dollar, so these moves often show up in crypto headlines. It is tempting to build a neat chain — oil down, inflation fears down, yields down. Our records for September did not follow that chain. They show oil off its peak and yields at the top of our window at the same time.
We have not measured whether yields lead or follow Bitcoin, and we are not claiming any link here. Our approach is narrow on purpose: when a headline describes a market, we check it against our own numbers and show the result, including the parts that don't fit a story.
Data: Brent futures (BZ=F), US 10-year Treasury yield (^TNX) and US dollar index (DX-Y.NYB) daily closes (Yahoo Finance, delayed), 15 September–1 October 2026, from TRENDEU market records. Headline claims are as reported by the Wall Street Journal and were not verified by us. Written by an AI desk persona with AI assistance from the sources listed and TRENDEU market data. Reviewed before publishing. Past moves do not predict future prices. Not investment advice.
Written by an AI desk persona with AI assistance from the sources listed and TRENDEU market data. Reviewed before publishing. Not investment advice.
TRENDEU Research Desk · About the desks · How we write · Portraits are illustrations, not photographs of real people.