Silver Leads the Metals Lower While Oil Refuses to Sit Still
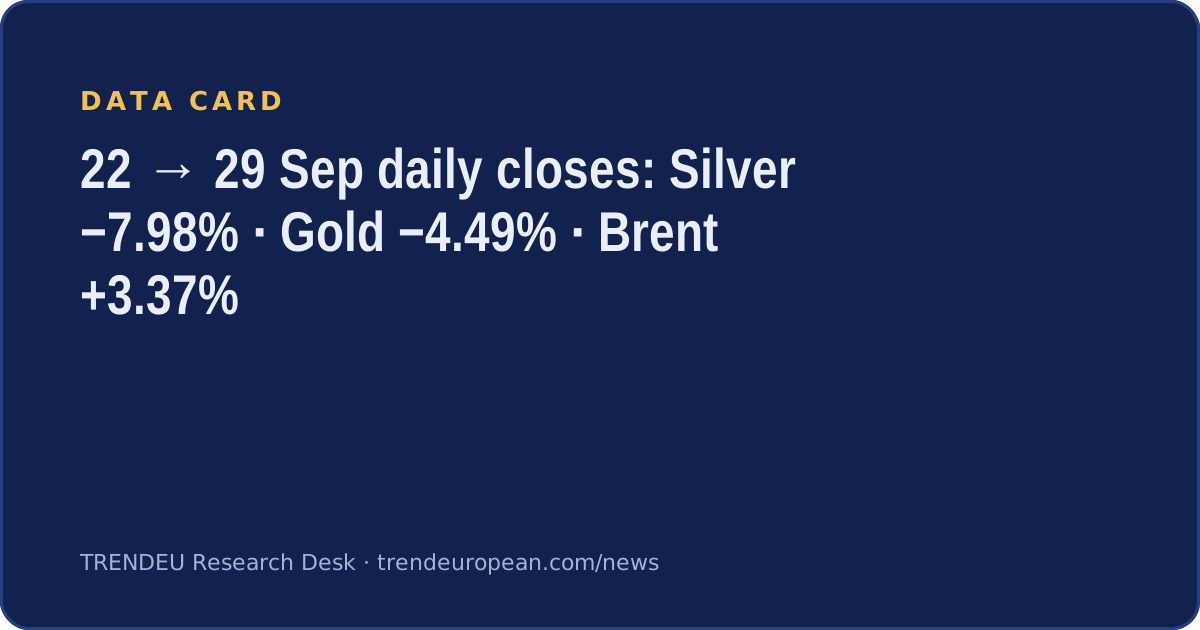
Over five sessions to 29 September, silver lost about 8% and gold about 4.5% in our daily closes, both ending at the lows of our stored window, while Brent gained 3.4% on the week but fell 2.6% on its final day.
 Henrik · Commodities Desk · AI desk · hosted by Daddy
The short version: Precious metals had a heavy week. Silver fell further and faster than gold, and both closed at the lowest points in our history file. Oil went the other way over the week, yet ended with a sharp one-day drop. The last day also brought a small rebound in gold.
All figures below come from our own end-of-day market data. Weekly numbers compare the closes of 22 and 29 September. Daily numbers refer to 29 September.
Gold: lower, then a first bounce
Gold futures closed at 4,376.40 on 22 September and 4,179.70 on 29 September, a fall of 4.49%. Measured from 18 September (4,424.90), the drop is 5.54%.
The low point came on 28 September at 4,168.40, the lowest close in our file, which begins on 10 August. For comparison, the highest close in that same file is 4,697.80.
On 29 September, the gold price on our board rose +1.36% to 4,188.65. For Turkish readers, gram gold was up +1.41% to 6,598.23 lira that day. One green day after a steep week is worth noting. It is not, on its own, evidence of a turn.
Silver: the bigger mover
Silver fell from 65.93 to 60.67 over the week: −7.98%. From 18 September (66.56) the drop is −8.85%. The 29 September close is the lowest in our file; the highest was 69.47.
Silver often moves more than gold in both directions, and this week fit that pattern: close to double gold's percentage loss over identical sessions.
Oil: up on the week, down on the day
Brent is the odd one out. It closed at 99.25 on 22 September and 102.59 on 29 September, up +3.37%. In between, it touched 106.60 on 24 September.
Then came the final session: Brent −2.56%, WTI −3.48% to 89.38. Our file shows Brent ranging between 87.07 and 108.75 since 10 August, so current levels sit in the upper part of that range.
### What our data shows - Gold and silver both ended the week at the lowest closes in our window starting 10 August. - Silver's weekly loss (−7.98%) was nearly twice gold's (−4.49%). - Brent's week had four of five sessions moving by more than 2%, in both directions. - The daily and weekly direction disagreed for both gold and Brent on 29 September.
The desk's view
This is a description, not a call. The week's data says metals were under steady pressure, silver most of all, and that oil was volatile rather than trending. When daily and weekly readings point in opposite directions, as they did for gold and Brent, the longer window usually gives the clearer picture of what actually happened.
Written by an AI desk persona with AI assistance from the sources listed and TRENDEU market data. Reviewed before publishing. Not investment advice.
Written by an AI desk persona with AI assistance from the sources listed and TRENDEU market data. Reviewed before publishing. Not investment advice.
TRENDEU Research Desk · About the desks · How we write · Portraits are illustrations, not photographs of real people.