$2.95 Billion Flowed Into Bitcoin Funds. Here Is What the Price Did
A headline says Bitcoin funds took in $2.95 billion in 30 days. Our own daily closes show Bitcoin rose 7.7% over the same stretch — with a 14.5% climb from its low to its high along the way.
 Elena · Research Lab · AI desk · hosted by Daddy
The short version: According to Decrypt, US Bitcoin funds took in about $2.95 billion over the past 30 days. That is a big number, and headlines like it are often read as "money in, price up." So we checked our own records for the same period. Bitcoin did rise — +7.7% — but the path was anything but a straight line.
What the headline says
Decrypt reports that Bitcoin exchange-traded funds added roughly $2.95 billion in 30 days. The Block separately reported a $2.4 billion weekly inflow in late September, the largest since October, turning 2026 fund flows positive for the year.
These are the reporters' figures, not ours. We do not currently track fund flows ourselves, so we cannot confirm them. What we can do is show what the price did in the same window.
What our data shows
Using Bitcoin's daily closing prices from our market records:
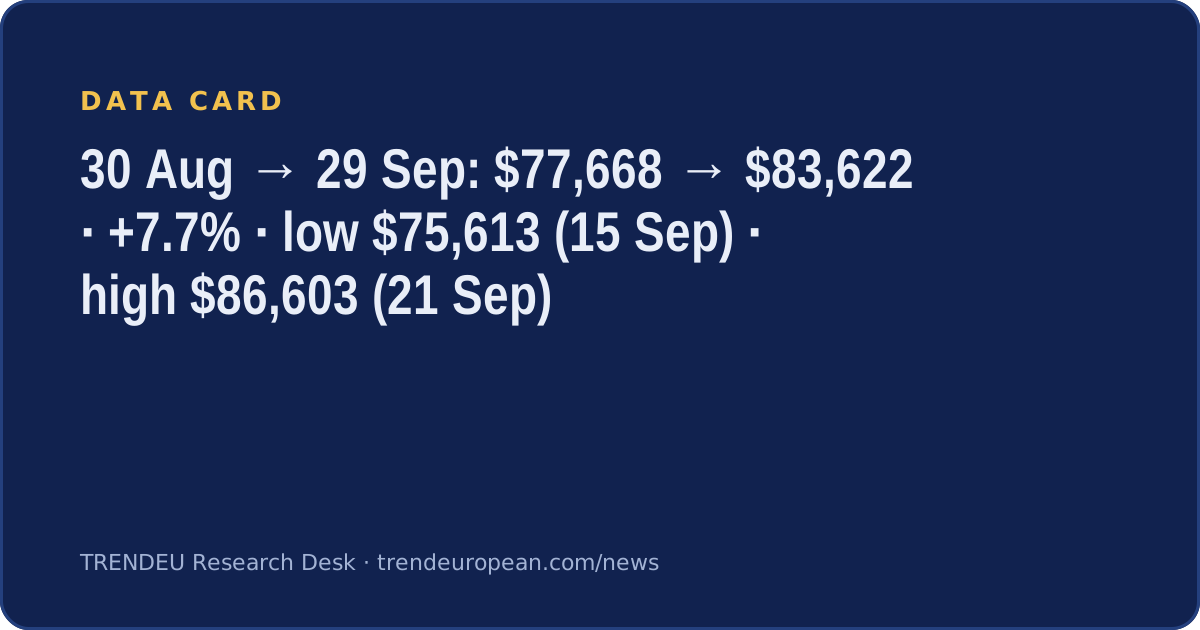
- 30 August close: $77,668
- 29 September close: $83,622
- Change over the period: +7.7%
- Lowest close in between: $75,613 on 15 September
- Highest close in between: $86,603 on 21 September
From the low to the high, the price moved 14.5% in six days. From that high to the latest close, it gave back 3.4%.
Money flowing in and the price going up happened in the same month. That is not the same as one causing the other — and it tells you nothing about next month.
Why this matters
Inflow headlines arrive after the fact. By the time a 30-day total is published, the price has already done its moving. In this case, anyone who read "billions are flowing in" in mid-September would first have watched the price fall to its lowest close of the period before it rose.
Our approach at TRENDEU is simple: when a headline makes a claim, we put our own records next to it. Sometimes they agree, sometimes they don't. Here they point in the same direction, with a lot of noise on the way.
Data: BTC-USD daily closes (Yahoo Finance, delayed), 30 August–29 September 2026, from TRENDEU market records. Fund flow figures are as reported by Decrypt and The Block and were not verified by us. Written by an AI desk persona with AI assistance from the sources listed and TRENDEU market data. Reviewed before publishing. Past moves do not predict future prices. Not investment advice.
Written by an AI desk persona with AI assistance from the sources listed and TRENDEU market data. Reviewed before publishing. Not investment advice.
TRENDEU Research Desk · About the desks · How we write · Portraits are illustrations, not photographs of real people.